Are You Measuring?

Like most law firm librarians, it is my responsibility to make sure that people in my organization have the information resources they need to do their work. We subscribe to a great number of resources and they are in so many formats and databases that locating specific items can be challenging. To make it easier for our users, my team has been creating what we call Practice Area Pages on our Intranet. We feed these pages with tools and information, both internally created and externally sourced.
One of the pages we have created supports our Insurance Practice Group. This page offers links to sources like our print and electronic texts on insurance law, insurance law blogs, our intranet article on the Alberta Minor Injury Regulation (Cap), judgment interest calculators, quick reference cards for some research tools, the Alberta Standard Automobile Policy and some endorsements, a present value calculator, a personal injury quantum search tool, and legislation.
I blogged about the Annotated Insurance Act that we crafted back in the fall. This tool also lives on the practice page. The annotated act we created in house was very well received by the group. We wanted to monitor its usefulness since it was a lot of work to create and will need occasional updating. We set up some tracking using our resource management software for that specific document as well as for the insurance practice page itself. I pulled some statistics for these resources and married with other information, these numbers give me useful information.
- The Insurance Practice Page had 42 unique users in 2012 (Not including library staff)
- We have just over 30 lawyers practicing full time in this area
- Seven of these users were legal support staff and two were firm administrative team members
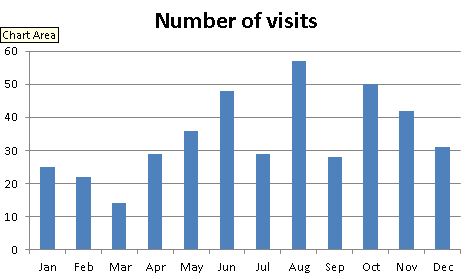
- Visits increase in months where library staff attend a practice group meeting (April, June, October)
- Visits dramatically increased when the Annotated Act was introduced (August)
The Annotated Insurance Act document was accessed 38 times in 2012 by people other than library staff members. It was created in August and instructions to download it to mobile devices were included. Some people have only visited it once for visit durations that would be equal to a device download, but many have used it on more than three occasions. The document was open for eight and a half hours in 2012. So far in 2013, it has been used 15 times and been open in a browser window for over four and a half hours.
What have I learned from monitoring usage statistics on these two library created products?
- Creating the annotated act was useful for the group – most of them have used it and many have used it several times
- The annotated insurance act is seven months old and the hours spent creating it are less than the hours it has been used by people outside the library
- The Insurance Practice Page is a useful tool for the group based on the number of visits and the number of unique users
- The visibility of library staff at practice group meetings has a positive impact on the use of tools like Practice Area Pages
- The investment for library staff keeping our intranet resources fresh and useful is worthwhile
What do you measure?

What do you use to measure?
My firm uses Onelog as our resource management software.